 and
and  data. The
small energy corrections are made by lining up the most prominent
 state from the
  reaction.
This is a
  state with an excitation energy of
 MeV [Ajz85]. The state is shown in figure
Once the separate runs have been processed and the various gated energy
spectra extracted in each case the spectra are all summed together.
Despite the gamma peak calibration discussed at the end of section
![]() the
spectra will not be perfectly aligned. This is the result of the actual
energy fluctuations in the proton beam from the cyclotron. Small shifts are
especially evident between runs occurring several months apart. These
shifts are not enough to compromise the data, or affect the azimuthal
cuts described above, however, it is necessary to line up the spectra
closely in order separate the
the
spectra will not be perfectly aligned. This is the result of the actual
energy fluctuations in the proton beam from the cyclotron. Small shifts are
especially evident between runs occurring several months apart. These
shifts are not enough to compromise the data, or affect the azimuthal
cuts described above, however, it is necessary to line up the spectra
closely in order separate the  and
and  data. The
small energy corrections are made by lining up the most prominent
 state from the
  reaction.
This is a
  state with an excitation energy of
 MeV [Ajz85]. The state is shown in figure
 ![]() .
.

Figure:  energy spectrum from the
  reaction at
  . The
. The  (4.15 MeV) state is
labelled.
Typically, the  cross-section spectra are obtained by
subtracting the
 from the
  spectra according to the formula
Then the deuterium spin observables would be obtained by a cross section
weighted difference of the spin observables for carbon and 
where  represents a spin observable for target x.
For these experiments true cross-sections were not measured. So, it was
necessary to find a method to compare the count spectra from the two
targets
on an equal basis. This can be done by normalizing the count spectra to
total beam on target, live fraction, and target thickness. However, this
was not always the best method because for at least part of the experiment
the Faraday cups which measured total integrated beam on target were
shorted to ground by rain water and entirely useless. The other method for
comparing the
count spectra is by subtracting a weighted  spectra from
the
  spectra until the
  ground state and
4.15 MeV state have disappeared.
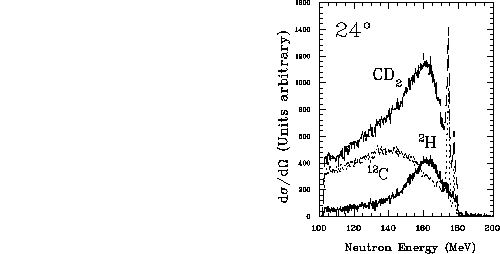
A sample of this type of subtraction is shown in figure
 ![]() .
.

Figure: Overlay of the  ,
,  and
and
 spectra at
  . The deuterium spectra was obtained by a
weighted subtraction of the carbon from the
  .
.
In terms of the count,  , equation
 ![]() becomes
becomes

where  is the mass fraction of deuterium in the
  target
and R is the adjustable parameter which determines the weight of the
carbon subtraction. Equation
 ![]() can also be expressed in terms of
R
can also be expressed in terms of
R

or

where

This method works best at  and
and  where the
deuterium final state interaction has a higher excitation energy than the
 4.15 MeV state and the part of the neutron spectrum above
the final state can be forced to integrate to zero. At
  and
and
 the area of the subtracted spectrum around the 4.15 MeV state is
fit to a smooth curve and the optimal R found by minimizing the
 .
.