V. Applications
A. Atmospheric Spectroscopy: One of the principal applications of the THz spectral region has been the remote sensing of the atmosphere of the Earth. This has been an extremely successful application because the characteristics of THz spectroscopic interactions are especially well suited to this task. As a result, a number of sophisticated and powerful instruments have been developed. (1) (2) (3) (4) (6) (7) (8)
Most of the focus of this work has been on the study of the complex processes which lead to the formation and destruction of ozone in the upper atmosphere. (13) Because of the complexity of the models designed to predict future trends and the effects of policy decisions on these trends, remote sensing data is vital not only to monitor the concentrations of the ozone itself, but also of the many contributors to the ozone cycle.
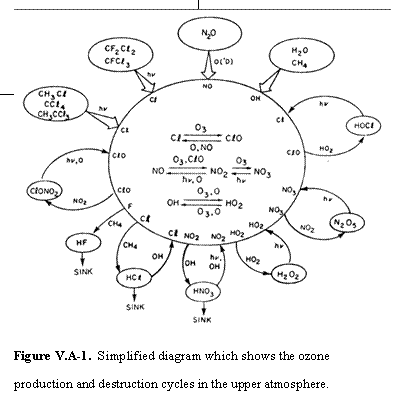
Figure V.A-1 shows that major contributors to ozone destruction are catalytic cycles of the type: X + O3 → XO + O2 and XO + O→ X + O2, with the net result O + O3→ 2O2. The catalyst X is typically NO, OH, or Cl, which is often produced by either photochemistry or reactions with atomic oxygen from long-lived precursors.

Figure V.A-2 illustrates mixing ratios of a number of these species as a function of altitude. Because many of the processes are catalytic, even small concentrations of key species have major impact on the overall cycle. As a result it has been necessary to develop instruments capable of measurement of concentrations below the ppb (10-12) level.
THz instruments have been able to meet this challenge because of the fundamental characteristics of molecular interactions discussed in Section II. Of equal importance, it has been possible to develop instruments that in many cases approach fundamental theoretical limits. This has been in many ways a remarkable achievement in a spectral region which is often considered to be technology limited and speaks to the progress that can be achieved by requirement driven and tested technology development.
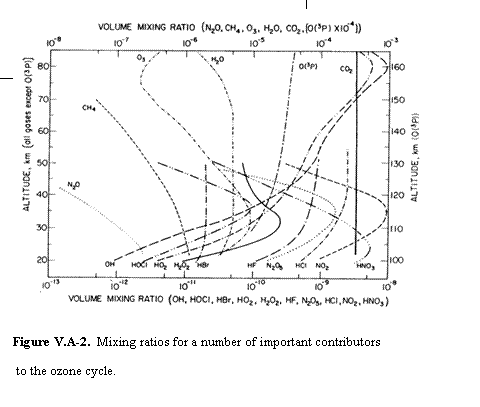
The most obvious foundation for these successes is the strong interactions between THz radiation and molecules. However, an important additional factor is that the THz region lies energetically below kT at atmospheric temperatures. As a result, it is possible to observe the thermal emissions from these molecular species in a limb sounding geometry against the colder background of space. In these experiments, the beam of the instrument is scanned vertically through the atmosphere and sophisticated deconvolution techniques make possible the recovery of vertical profiles similar to those shown in Figure V.A-2 at near diffraction limited angular resolution. In contrast, most infrared instruments work in absorption, using the sun as a source, limiting their observations to sunrise and sunset.
Another contributor to this success is that much of the ozone cycle occurs at relatively high altitude. This reduces the pressure broadening (~ 5 GHz at sea level) and gives rise to a spectroscopic richness which can approach that obtained in the laboratory studies discussed above. Not only does this provide unique spectroscopic signatures, but it also makes it possible to choose spectral regions for the study of trace species that are not contaminated by spectra from the much more abundant species such as O3 and H2O. In order to take advantage of this complexity, considerable effort has been devoted to the characterization and ultimately cataloging (14) JPL & Koln of the spectra of atmospheric species. This effort has to be comprehensive because it is necessary not only to know the spectroscopy of the target species, but also that of any possible interlopers.
In this section two complementary approaches to atmospheric spectroscopy in the THz will be discussed: systems based on the extension of "microwave" technology to higher frequencies and systems based on the extension of "infrared" technology to longer wavelength. There are a number of examples of both approaches,1-8 but we will focus on Microwave Limb Sounder (MLS) (7) as an example of the former and FIRS-2 (8) as an example of the latter. Both are important and interesting in their own right, but they more generally serve as examples of the different approaches to spectroscopy in the THz.
The similarities and contrasts of systems based on each approach are noteworthy. Because sensitivity, resolution, and measurement speed are major issues for both, optimal use of each photon emmitted by the atmosphere is required. As a result both are multiplex instruments, but with very different implementations. Similarly, both represent technological challenges as their core technologies are extended into the THz, but again these challenges are very different.
1. Microwave Like Instruments: One of the most successful instruments which makes use of the THz spectral region for atmospheric remote sensing is the Microwave Limb Sounder (MLS). The First version of MLS was launched as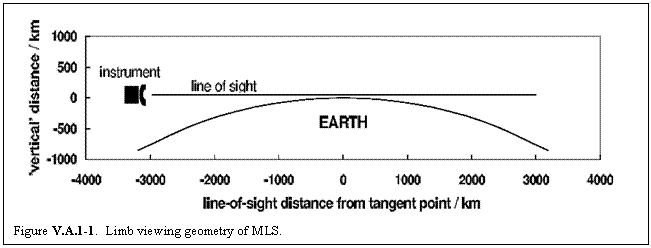 a part of the Upper Atmospheric Research Satellite (UARS) in 1991 and operated successfully for more than a decade. It measured thermal emission from the limb of the Earth's atmosphere to retrieve vertical profiles of selected atmospheric gases, as well as temperature and pressure. A second generation of MLS, Microwave Limb Sounder Home designed to observe a broader range of molecular species launched on July 15, 2004 as a part of the AURA mission of NASA's Earth Observing System (EOS) (http://eospso.gsfc.nasa.gov/).
Figure V.A.1-1 shows the limb viewing geometry of MLS. A significant feature of MLS is that because it operates in the Submillimeter/ Terahertz region, the natural thermal emission of the atmosphere provides the source of the observed radiation, whereas at infrared and shorter wavelength molecular species are ordinarily observed as absorptions in the solar radiation. This latter viewing geometry restricts observatio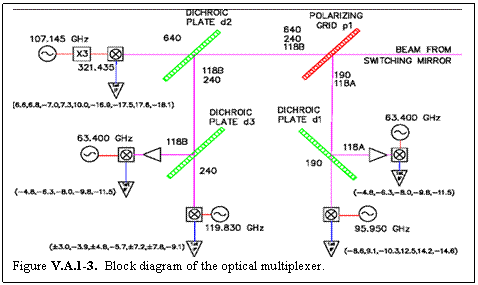 ns to sun rise and sun set.
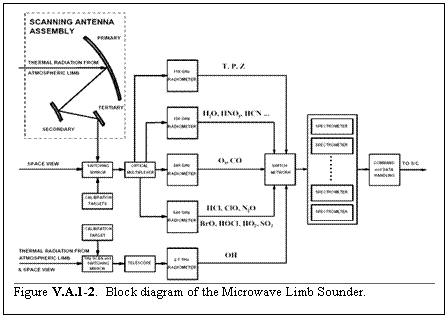
Figure V.A.1-2 shows a block diagram of EOS MLS, which contains many features common to THz remote sensing instruments, and illustrates the symbiosis between the development of technology and scientific applications in the THz. In most THz applications, photons are precious and not to be wasted. In MLS after a 1.6m telescope collects the photons from the atmospheric limb and coupling to the thermal loads needed for accurate calibration of the instrument is provided for, the photons are efficiently split into separate channels by a passive optical multiplexer, consisting of dichroics and a polarizing grid. Details of the optical multiplexer and mixers are shown in Fig.V.A.1-3. The mixers down-convert the spectral information to an ~ 2 - 20 GHz intermediate frequency (IF) where they are amplified and sent to multichannel filter banks.

Figure V.A.1-5. Simulated spectra in the 640 GHz channel at three pressure altitude/pressure points (upper 100 mb tangent point, middle 30 mb tangent point, and lower 10 mb tangent point.
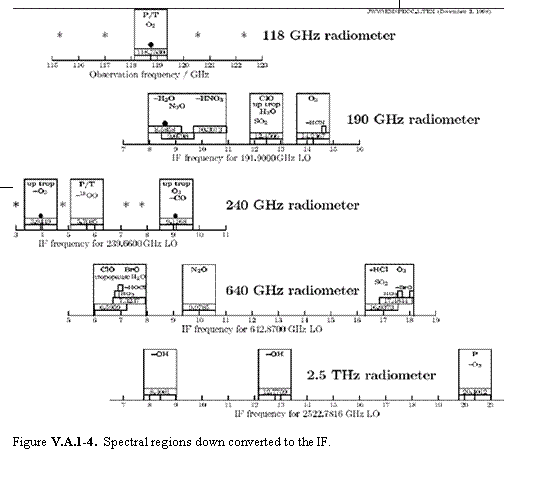
Fig.V.A.1-3 the down-converted frequency of each spectral feature to be observed is shown in parentheses below each IF amplifier. Figure V.A.1-4 shows the signals down-converted to the IF in more detail and Figure V.A.1.5 a simulated spectrum for the 640 GHz channel. To increase S/N a smaller antenna is used to feed separately the 2.5 THz radiometer from a smaller 0.25 meter antenna.
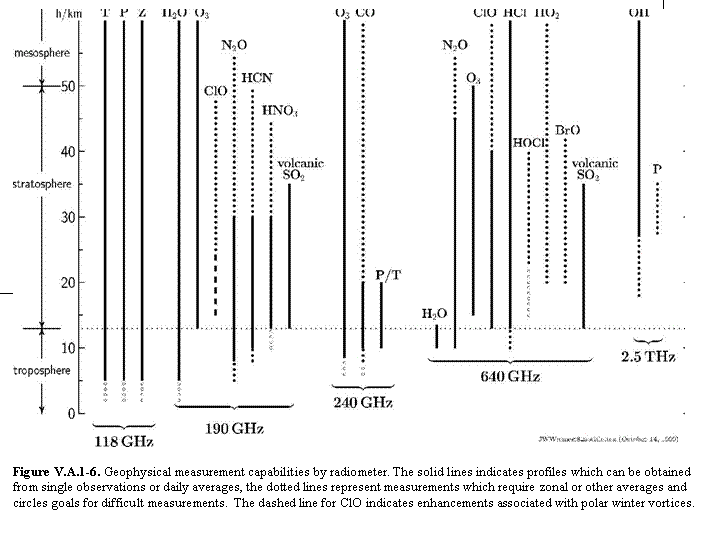
Finally, in Fig.A.1-6 the overall measurement capability of the instrument is shown. The low altitude limits are set by the increasing pressure broadening that can be observed in Fig.V.A.1-5 and by continuum contributions. At high altitudes the decreasing number density of the atmosphere with altitude finally dominates the advantages that come with narrower line-widths, and signal levels drop below the noise. Thus, the initial splitting of the photon stream in the optical multiplexer, subsequent mixing followed by amplification at intermediate frequencies, and the availability of multichannel filter banks, at the IF to simultaneously measure and record the atmospheric spectra result in an instrument of high resolution and large multiplex advantage. Because broadly tunable instruments in this spectral region are not yet possible, an important design consideration for these instruments has been a careful analysis of the spectral characteristics of all known atmospheric molecules. This analysis makes possible the selection of center frequencies for each channel which maximize the number of species that can be observed within the available IF and filter bank width. While many of the strong lines used for retrievals have been known to spectroscopists for some time, the elimination of the possibility of spectral coincidences from unknown lines, especially the weaker lines (excited vibrational states, isotopic species, high lying rotational states, etc.) of species abundant in the atmosphere (e.g. ozone or nitric acid) has been a significant spectroscopic challenge.
2. Infrared Like Instruments: An excellent example of an 'infrared-like' instrument which operates in the Submillimeter Terahertz is the FIRS-2 Fourier Transform Spectrometer operated by the Smithsonian Astrophysical
 Observatory Far-Infrared Spectroscopy Group (http://cfa-www.harvard.edu/firs). (15) It is balloon or aircraft borne and covers the far-(80 - 340 cm-1) and mid-infrared (330 - 1220 cm -1) with an apodized resolution of 0.008 cm-1 (240 MHz). The longer wavelength of these two regions corresponds to 2.67 - 11.33 THz and overlaps nicely with the region typically thought of as the high frequency end of the THz. In this region, thermal sources produce significant power even at atmospheric temperatures and (as does MLS) FIRS-2 observes the stratosphere in thermal mission. This enables it to make abundance measurements during both day and night in any azimuth heading. Additionally, although obtained in a very different way, like MLS, FIRS-2 is a multiplex instrument that simultaneously observes many species. The heritage of FIRS-2 is that of an optical FTIR and its layout is shown in Fig. V.A.2-1. The configuration shown here is that designed for use on the NASA DC-8 platform. FTIR instruments are multiplex in that all of the energy over a very wide band is simultaneously present on the detectors. The spectra is then recovered via a Fourier Transform of the signal which is recorded as a function of the optical path difference as one of the reflective corner cubes is translated. More specifically, for FIRS-2 the light enters the system at the left where vertical resolution in the atmosphere is obtained with an elevation scan mirror.
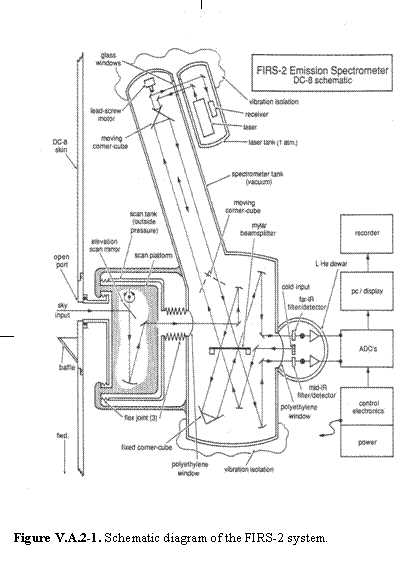
It is a dual input dual output system with one image being the sky image and the other a cold source in the detector dewar. The two beams are combined on the left half of the Ge coated Mylar beam splitter. The reflected beam goes to the moving corner cube and the transmitted beam to the fixed corner cube. The beams are then recombined on the right of the beam splitter and focused onto the two detectors. Both are liquid helium photo conductors, with one being for the region ~80 - 320 cm-1 and the other for the regio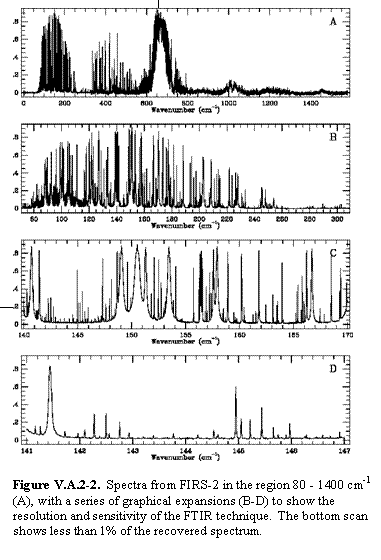 n ~ 320 - 1560 cm-1 limit is set by the cutoff of the photo conductors. The separation into two bands increases the sensitivity of the long wave length portion by isolating it from the strong mid-infrared flux.
Figure V.A.2-2 shows sample spectra on four different frequency scales. All spectra were recorded at a tangent height of ~33 m and are from a 1997 Alaska flight. In its balloon mode, the interferometer scan takes 6 minutes to complete.
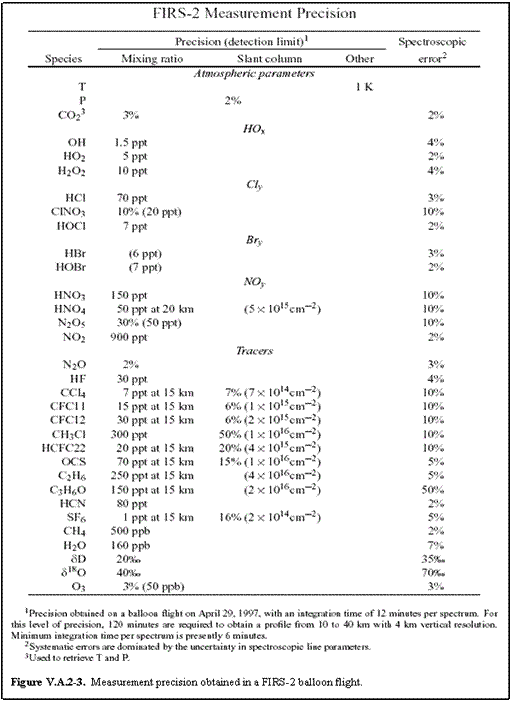
As can be seen in Fig. V.A.2-2, instruments of this type record the complex spectra from any molecules simultaneously. FIRS-2 has been used to retrieve mixing ration profiles for an impressive and diverse set of species, including H2O, CO2,O2, O3, N2O, HCN, CO, HF, HCl, HOCl, NO2, HNO3, OH, H2O2, HO2, HBr, ClNO3 N2O5, C2H6, C3H6O, HNO4, CFC12, CFC11, HCFC22, CCL4, CH3Cl, SF6, OCS, and CH4. These simultaneous measurements make it possible to place tight constraints on photochemical models. FigureV.A.2-3 shows the details of the precision of atmospheric measurements from a balloon flight on April 29, 1997.
References
[1] R. M. Bevilacqua, J. J. Olivero, P. R. Schwartz, C. J. Gibbins, J. M. Bologna, and D. J. Thacker, "An Observational Study of Water Vapor in the Mid-Latitude Mesosphere Using Ground-Based Microwave Techniques," J. Geophysical Research, vol. 88, pp. 8523, 1983.
[2] B. Carli, F. Mencaraglia, and A. Bonetti, "Submillimeter high-resolution FT spectrometer for atmospheric studies," Appl. Opt., vol. 23, pp. 2594, 1984.
[3] J. W. Barrett, P. M. Solomon, R. L. de Zafra, M. Jaramillo, L. Emmons, and A. Parrish, "Formation of the Antarctic Ozone hole by the ClO Dimer Mechanism," Nature, vol. 336, pp. 455-459, 1988.
[4] B. Carli and J. H. Park, "Simultaneous Measurement of Minor Stratospheric Constituents with Emission Far-Infrared Spectroscopy," J. Geophys. Res., vol. 93, pp. 3851, 1988.
[5] J. W. Waters, Atmospheric Remote Sensing by Microwave Radiometry. Wiley, New York, 1993.
[6] M. L. Santee, G. L. Manney, L. Froidevaux, W. G. Read, and J. W. Waters, "Six years of UARS Microwave Limb Sounder HNO3 Observations: Seasonal, Interhemispheric, and Interannual Variations in the Lower Stratosphere," J. Geophys. Res., vol. 104, pp. 8225-8246, 1999.
[7] J. W. Waters, W. G. Read, L. Froidevaux, R. F. Jarnot, R. E. Cofield, D. A. Flower, G. K. Lau, H. M. Picket, M. L. Santee, D. L. Wu, M. A. Boyles, J. R. Burke, R. R. Lay, M. S. Loo, N. J. Livesey, T. A. Lungu, G. L. Manney, L. L. Nakamura, V. S. Perum, B. P. Ridenoure, Z. Shippony, P. H. Siegel, R. P. Thurstans, R. S. Harwood, H. C. Pumphrey, and M. J. Filipiak, "The UARS and EOS Microwave Limb Sounder Experiments," J. Atmos. Sci., vol. 56, pp. 194-218, 1999.
[8] K. W. Jucks, D. G. Johnson, K. V. Chance, W. A. Traub, J. J. Margitan, G. B. Osterman, R. J. Salawitch, and Y. Sasano, "Observation of OH, HO2, H2O, and O3 in the Upper Stratosphere: Implications for HOx Photochemistry," Geophys. Res. Lett., vol. 21, pp. 3935-3938, 1998.
[9] G. Dobson, D. Harrison, and J. Lawrence, "Measurements of the amount of ozone in the Earth's atmosphere and its relation to other geophysical conditions," Proc. R. Soc. London, vol. A122, pp. 456-486, 1929.
[10] S. Chapman, "On ozone and atomic oxygen in the upper atmosphere," Philos. Mag., vol. 10, pp. 369, 1930.
[11] D. Bates and M. Nicolet, "Atmospheric hydrogen," Astron. Soc. Pac. Leafl., vol. 62, pp. 106, 1950.
[12] P. Crutzen, "The influence of nitrogen oxide on the atmosphereic ozone content," Q. J. R. Meteorol. Soc., vol. 96, pp. 320-325, 1970.
[13] M. Molina and F. Rowland, "Stratospheric sink for chlorofluoromethanes: Chlorine atom catalysed destruction of ozone," Nature, vol. 249, pp. 810-812, 1974.
[14] H. M. Pickett, R. L. Poynter, E. A. Cohen, M. L. Delitsky, J. C. Pearson, and H. S. P. Muller, "Submillimeter, Millimeter, and Microwave Spectral Line Catalog," J. Quant. Spectrosc. Rad. Transfer, vol. 60, pp. 883-890, 1998.
[15] D. G. Johnson, K. W. Jucks, W. A. Traub, and K. V. Chance, "Smithsonian stratospheric far-infrared spectrometer and data reduction system," J. Geophys. Res., vol. 100, pp. 3091-3106, 1995.