In order to extract the response functions from the measured spin observables one must choose a set of nn amplitudes which can be compared to the nuclear responses. As mentioned in the previous section, amplitudes calculated using the Argonne potential [WSA84] were chosen for this data. This means that the calculation of the response functions is, in fact, model dependent, but this is unavoidable. Again, as previously mentioned, several different models were investigated and the results seem, within the levels of uncertainty present, fairly robust.
In order to make the results only as model dependent as necessary the response functions are presented as the ratio of the longitudinal response function to the transverse response function. This technique will cancel out the effects of distortion assuming that the distortion factors are spin independent.
From equations ![]() to
to ![]() , in the optimal frame the ratio
of the longitudinal to transverse spin observables will be
, in the optimal frame the ratio
of the longitudinal to transverse spin observables will be
where  ,
,  ,
,  , and
, and  are the optimal frame
amplitudes for nn scattering. A calculation of those amplitudes using the
Argonne potential indicates that for all values of energy loss in these
experiments, at all angles measured the ratios of
 and
and  are less than
0.1%. Therefore, it is possible to ignore the terms which include the
 amplitudes and write

or,

Figure ![]() shows the ratio
shows the ratio  for both deuterium and
carbon at
  . Also included is
  from the Faddeev
calculations (short-dashed line) and from free scattering (long-dashed
line).

Figure:  versus energy loss for both deuterium and carbon at
 . The short-dashed line are the results from the
Faddeev calculations and the long-dashed line is the free scattering result
from the Argonne potential. The vertical dotted line indicates the energy
loss for free np scattering.
This ratio appears to be more consistent with the free np scattering than
with the Faddeev calculations. Also the difference between the deuterium
and carbon data seem negligible. Figure ![]() shows the ratio
shows the ratio
 . In this case the data seems consistently high compared to
both the Faddeev calculations and the free scattering calculations except,
perhaps, in the tail region where statistics are poor.
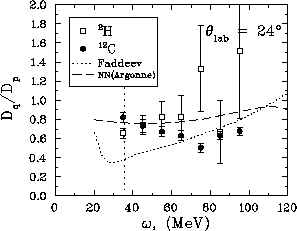
Figure:  versus energy loss for both deuterium and carbon at
 . The short-dashed line are the results from the
Faddeev calculations and the long-dashed line is the free scattering result
from the Argonne potential. The vertical dotted line indicates the energy
loss for free np scattering.
Finally, to get the ratio of the longitudinal response to the transverse
response  is divided by
  . This result is
shown in figure
 ![]() .
.

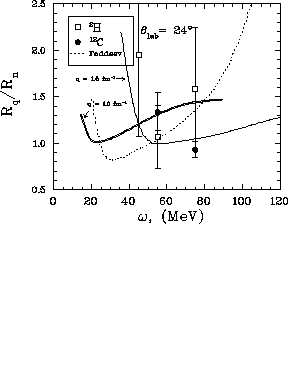
Figure: Response function ratio  versus energy loss showing
both the deuterium and carbon data at
  . The
dashed line indicates the results
of Faddeev calculations. Also shown are the results from
[Pan94] at
  (double line) and
 (thick solid line).
Also shown on figure ![]() are the results from the Faddeev
calculations and some results from [Pan94] obtained by the methods
described in section
are the results from the Faddeev
calculations and some results from [Pan94] obtained by the methods
described in section ![]() . The results from [Pan94] are
not completely
representative of the experimental data. The two sets of calculations were
done at a
constant momentum transfer,
. The results from [Pan94] are
not completely
representative of the experimental data. The two sets of calculations were
done at a
constant momentum transfer,  fm
fm and 1.5 fm
 , whereas
the data were taken at a constant scattering angle. At
  this
means that momentum transfer will vary over the range of energy loss from
 fm
fm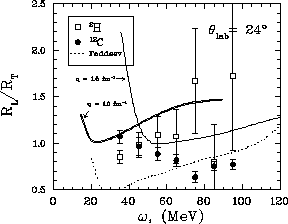 to
to  fm
fm . In other words
the best that can presently be said is that the data should ideally
behave in a similar manner as the results from [Pan94]. That being
the case,
the results shown in figure
 ![]() are striking in that the data
does agree better with the [Pan94] results than with the Faddeev
calculations. Figure
are striking in that the data
does agree better with the [Pan94] results than with the Faddeev
calculations. Figure ![]() shows the same plot as figure
shows the same plot as figure
![]() except that the three data points at the high momentum
transfer have been grouped into one 30 MeV bin to try to improve the
statistics.
except that the three data points at the high momentum
transfer have been grouped into one 30 MeV bin to try to improve the
statistics.

Figure: Response function ratio  versus energy loss showing
both the deuterium and carbon data at
  . The
dashed line indicates the results
of Faddeev calculations. Also shown are the results from
[Pan94] at
  (double line) and
 (thick solid line). The data at high energy loss
have all been binned together to improve statistics.
The data seem even more consistent with the predictions from [Pan94].
Typically the ratio,  , is derived using the
  transverse spin observable because, as mentioned above, the small values of
the
  and
and  amplitudes decouple the equations for
  and
and 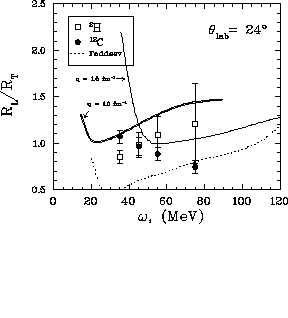 in terms of
  and
and  .
.  can still be determined as a function of both
  and
and  , but usually
the results are considerably more uncertain. This is shown in figure
![]() .
.

Figure: Response function ratio  versus energy loss showing
both the deuterium and carbon data at
  . The
dashed line indicates the results
of Faddeev calculations. Also shown are the results from
[Pan94] at
  (double line) and
 (thick solid line). The data at high energy loss
have all been binned together to improve statistics.
The huge uncertainties make it impossible to draw any conclusions from the
ratio  .
.
For the  data the two ratios of spin longitudinal c.m. spin
observables to transverse c.m. spin observables are show in figures
![]() and
and ![]() .
.

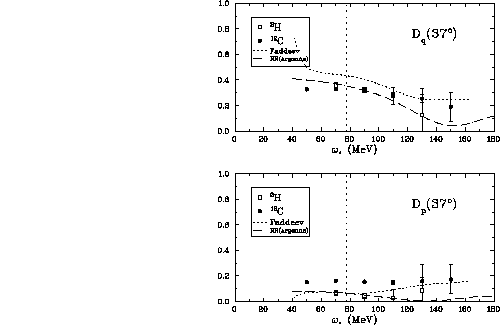
Figure:  versus energy loss for both deuterium and carbon at
 . The short-dashed line are the results from the
Faddeev calculations and the long-dashed line is the free scattering result
from the Argonne potential. The vertical dotted line indicates the energy
loss for free np scattering.

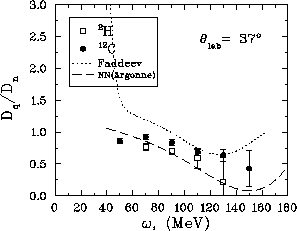
Figure:  versus energy loss for both deuterium and carbon at
 . The short-dashed line are the results from the
Faddeev calculations and the long-dashed line is the free scattering result
from the Argonne potential. The vertical dotted line indicates the energy
loss for free np scattering.
From figure ![]() one can see that
one can see that 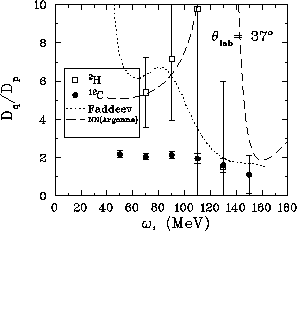 has become very small, and
this is revealed again in figure
 ![]() (notice the scale). In
dividing by such a small number it is difficult to say much about
(notice the scale). In
dividing by such a small number it is difficult to say much about
 .
.  is a little easier to follow in figure
![]() . The deuterium data seems to agree better here with the
free scattering calculations than the Faddeev results.
. The deuterium data seems to agree better here with the
free scattering calculations than the Faddeev results.
The response ratio,  , is shown in figure
 ![]() along
with Faddeev calculations for
along
with Faddeev calculations for  and the same computational results
from [Pan94] as were shown with the
  response function
ratios.

Figure: Response function ratio  versus energy loss showing
both the deuterium and carbon data at
  . The
dashed line indicates the results
of Faddeev calculations. Also shown are the results from
[Pan94] at
  (double line) and
 (thick solid line).
The deuterium data can be said to be consistent with both the Faddeev
calculations and the results from [Pan94] near the quasifree peak
where the statistics are good enough to still make a statement. The
momentum transfer in this region will be about  fm
fm .
Interestingly, the response ratio for the carbon data has fallen
significantly at
  and seems to be substantially different than
the deuterium, which it was not at
  .
.