 data, the data taken at
  was binned by 10
MeV in order to get the acceptable statistics. The spin-observable
results for the normally
  polarized incident beam for the
 and
and  reactions are given in tables
As with the  data, the data taken at
  was binned by 10
MeV in order to get the acceptable statistics. The spin-observable
results for the normally
  polarized incident beam for the
 and
and  reactions are given in tables
 ![]() and
and ![]() ,
respectively.
,
respectively.

Table: Spin-observable results from the
 reaction at
  for an
  polarized proton beam with
  MeV.
MeV.

Table: Spin-observable results from the
 reaction at
 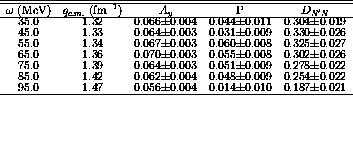 for an
  polarized proton beam with
  MeV.
MeV.
The  results at
  are also presented in figure
![]() . As with the
. As with the  data, the analyzing power and induced
polarization seem to agree with the results of the Faddeev calculations
[Wit96], and the
  data and
  data track with
each other. The measured value of
 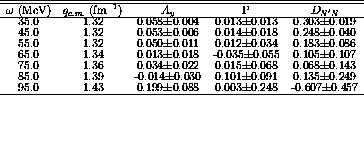 for
for  does
not agree with calculations near the quasifree peak, as with the
 data, but is consistent with
expectations in the tail region.

Figure: Spin-observable results from the
 and
and  reactions at
  for an
  polarized proton beam with
  MeV. The
excitation spectra are shown at the top. The dashed line show the results
of Faddeev calculations of the spin-observables for the deuterium
reaction. The vertical dotted line indicate the energy loss for free np
scattering.
The results for the sideways and longitudinal incident beams for the
 reaction at a scattering angle of
 are compiled in tables
![]() and
and ![]() , respectively. Similarly, the
spin-observables from the
, respectively. Similarly, the
spin-observables from the  are shown in
tables
 ![]() and
and ![]() for the sideways and
longitudinally polarized beams, respectively.
for the sideways and
longitudinally polarized beams, respectively.

Table: Spin-observable results from the
 reaction at
  for an
  polarized proton beam with
  MeV.
MeV.

Table: Spin-observable results from the
 reaction at
 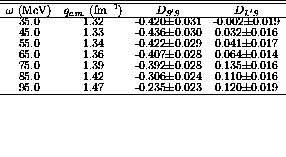 for an
  polarized proton beam with
  MeV.
MeV.

Table: Spin-observable results from the
 reaction at
 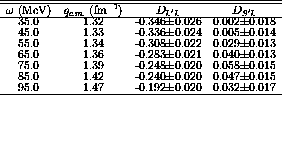 for an
  polarized proton beam with
  MeV.
MeV.

Table: Spin-observable results from the
 reaction at
 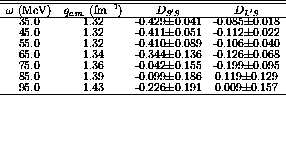 for an
  polarized proton beam with
  MeV.
MeV.
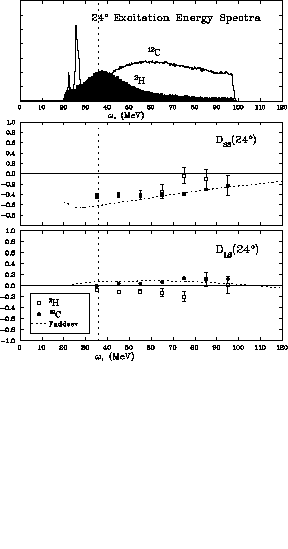
The results from the sideways and longitudinal data are also shown in
figures ![]() and
and ![]() , respectively. The diagonal in-plane
spin-observables seem to deviate slightly from the Faddeev calculation in
both the quasifree peak and far out in the tail, but generally seem to
agree.
As for the off diagonal terms,
, respectively. The diagonal in-plane
spin-observables seem to deviate slightly from the Faddeev calculation in
both the quasifree peak and far out in the tail, but generally seem to
agree.
As for the off diagonal terms,  for the
  takes
on the opposite sign from both the Faddeev results and the
  results, but the magnitude is small.

Figure: Spin-observable results from the
 and
and  reactions at
  for an
  polarized proton beam with
  MeV. The
excitation spectra are shown at the top. The dashed line show the results
of Faddeev calculations of the spin-observables for the deuterium
reaction. The vertical dotted line indicate the energy loss for free np
scattering.

Figure: Spin-observable results from the
 and
and  reactions at
  for an
  polarized proton beam with
  MeV. The
excitation spectra are shown at the top. The dashed line show the results
of Faddeev calculations of the spin-observables for the deuterium
reaction. The vertical dotted line indicate the energy loss for free np
scattering.
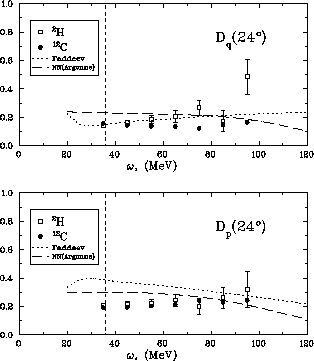
The center-of-mass spin observables,  's, are shown in figures
![]() and
and ![]() . These results are also compared to the
results of Faddeev calculations (shown with the short-dashed line) and to
free np scattering results (shown with the long-dashed line) from
calculations based on the Argonne potential [WSA84].
. These results are also compared to the
results of Faddeev calculations (shown with the short-dashed line) and to
free np scattering results (shown with the long-dashed line) from
calculations based on the Argonne potential [WSA84].

Figure: 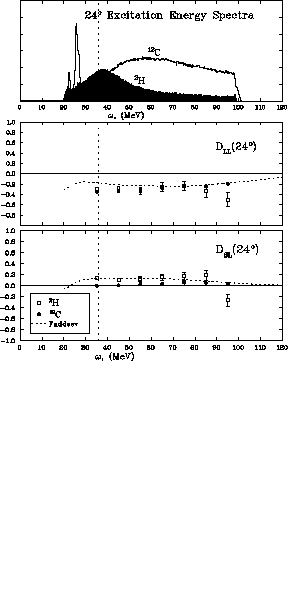 (spin 0) and
  (spin transverse,
 )
spin observables as a function of energy loss at
 .
Results from both deuterium and carbon are shown. The short-dashed line
are the results of Faddeev calculations of the deuterium spin observables.
The long-dashed line are the free np scattering results for the Argonne
potential.
The vertical dotted line indicates the energy loss for free np scattering.

Figure: 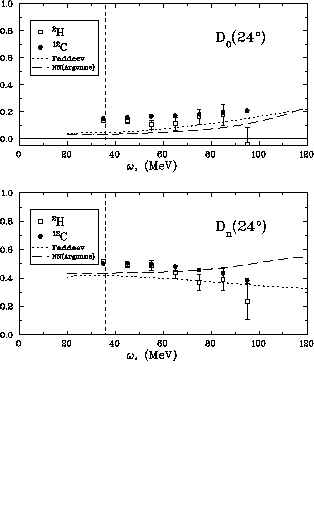 (spin longitudinal,
  ) and
) and  (spin transverse,
  )
spin observables as a function of energy loss at
  .
Results from both deuterium and carbon are shown. The short-dashed line
are the results of Faddeev calculations of the deuterium spin observables.
The long-dashed line are the free np scattering results for the
Argonne potential.
The vertical dotted line indicates the energy loss for free np scattering.
Interestingly enough, at the  scattering angle the
center-of-mass spin observables,
  's, for deuterium and carbon are
quite similar. This is interesting primarily because in the past the
deuterium response was treated as the free response [Che93]
[Lut93] [Tad94] and used to divide out the supposed free
scattering pieces
from the responses of heavier targets, such as
  , to look for
nuclear medium effects. Therefore,
the ratio of longitudinal to transverse responses had been given by

Figures ![]() and
and ![]() also show (dashed line) the
calculated values for np scattering based on the Argonne potential
[WSA84] and to some extent the deuterium results agree
with the carbon results more than they do with the calculated free
values or the Faddeev calculations. The exception to this is
also show (dashed line) the
calculated values for np scattering based on the Argonne potential
[WSA84] and to some extent the deuterium results agree
with the carbon results more than they do with the calculated free
values or the Faddeev calculations. The exception to this is  ,
especially at high loss, which may indicate interesting physics in the
longitudinal channel.
The Argonne
model was chosen because it is the basis for both the Faddeev calculations
[Wit96] and the Green's function Monte Carlo calculations
[Pan94] to which these data are being compared.
Other models were investigated (i.e. Nijmegan, Bonn, etc.) but no
significant difference was shown. That the
  and
and  data agree this closely may indicate the onset of nuclear medium effects
even in the small nucleus of deuterium as postulated in [Pan94].